| Objective Task |
You may have found a web
page with information about a historic event, a specific location, or a scientific
phenomena. In writing a report or preparing a study guide, you would like to include
only portions of the text in your report, which is being composed with a word processor.
| Note: |
There are two techniques
for displaying tabular data on a web page, one is tables and the other is through preformatted
text. If the text is in courier or typewriter looking font, then it
is most likely a preformatted table. If there are borders around at least
some of the cells or if the font is something other than courier, then it is most
likely displayed with tables. |
|
Preformatted
Tabular Data
These instructions apply to Microsoft
Excel. You can also move preformatted tabular data into Microsoft Works spreadsheet
for the Macintosh. I have not been able to get it to work on any other spreadsheet
program. |
| Step 1 |
Load the web page with the
tabular data into your browser. |
| Step 2 |
Using your mouse, highlight
the rows of data that you would like to include in your spreadsheet file. |
| Step 3 |
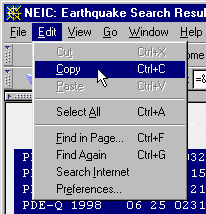 Pull down the Edit
menu of your browser and select Copy. This will make a copy of the
highlighted text, storing the data in your computers clipboard. Pull down the Edit
menu of your browser and select Copy. This will make a copy of the
highlighted text, storing the data in your computers clipboard. |
| Step 4 |
Start Microsoft Excel and
open a new spreadsheet file (or open an existing file in which you want to insert the web
data). Select the cell in which you want the top left corner of the data to be
stored. Pull down the Edit menu and select Paste. |
| Step 5 |
The data will appear in
your spreadsheet. As you examine the affects of pasting the data into the
spreadsheet, you will learn that all of the data was entered into the column of the cell
that you had selected. If you move one cell over to the right into the next column,
you will find that it is empty. |
| Step 6 |
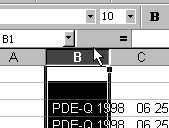 To repair
this, highlight the entire column that the data was pasted into. To repair
this, highlight the entire column that the data was pasted into. |
| Step 7 |
When the entire column of
the data has been highlighted, pull down the Data menu and select Text
to Columns... This will produce a wizard or series of dialog boxes that
will help you convert your data into a spreadsheet. |
|
 |
| Step 8 |
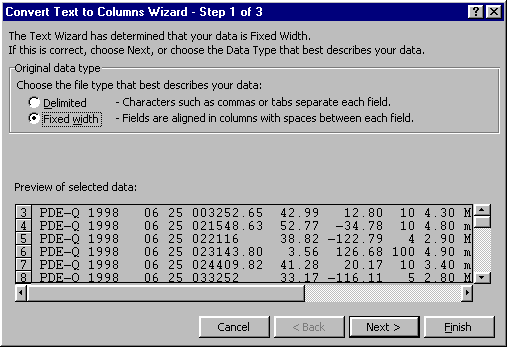
when the data has been preformated,
the Text to Columns wizard will default to Fixed width.
This is good. Click Next to go to the next step. |
|
 |
| Step 9 |
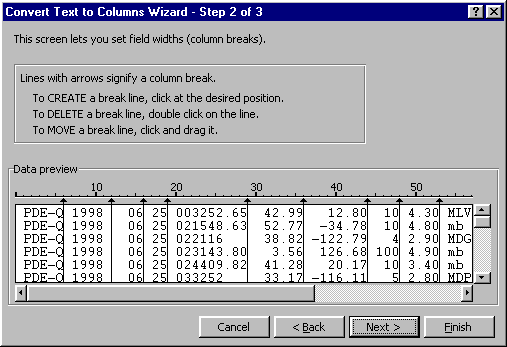
In this dialog box, the
program makes asumptions about where column divisions should happen. You can add new
dividers by clicking that spot with your mouse. You can also remove column division
lines by double clicking them. If you want to move a divider, just drag it with the
mouse. |
|
 |
| Step 10 |
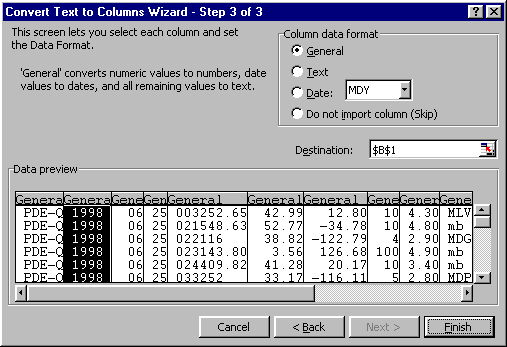
This dialog box allows you
to determine the type of information for each column. You can designate a
column, or combination of columns as General or numeric data, Text,
or Date. In the case of date, you can set the format that you want
it converted to. You can also select Do not import column to skip
the column all together. When you click Finish, you will have a
spreadsheet with the data inserted into specific cells. |
| Step 11 |
Now you can work with the
data with the functions available through the spreadsheet. If you want your students
to manipulate the data with Microsoft Works or ClarisWorks, or some other spreadsheet
program, you can save it as a tab-delimited file with Excel, and then open it into any of
the other programs. Here is a scatter graph produced with the earthquake data from
above. 
|
Tables
Formatted Tabular Data
These instructions apply to Microsoft
Excel. |
| Step 1 |
Tabular data that has been
formatted with table tags must be handled differently from preformated data. Rather
than copying and pasting the data, we must save the entire page. Pull down the File
men and select Save as... 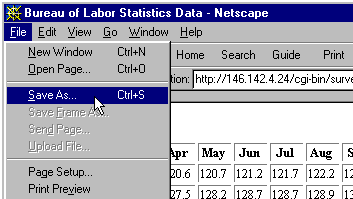
A standard file save dialog box will appear. Find a logical target
location for the saved file, be sure that the Save as type section is
stet for text, and save the file. |
| Step 2 |
Now we have to remove all
of the extraneous information, leaving only the data. To do this, load the text file
into a text processor, such as WordPad or NotePad. Then carefully delete out all of
the information except for the data itself. Then resave the file, with
".txt" as the extension. 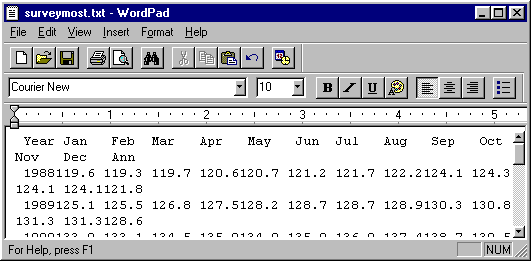
|
| Step 3 |
Start Microsoft Excel, and
open your saved file. It will automatically open up into the Text to
columns... wizard. From here, follow the directions beginning with Step
8 above. |

